
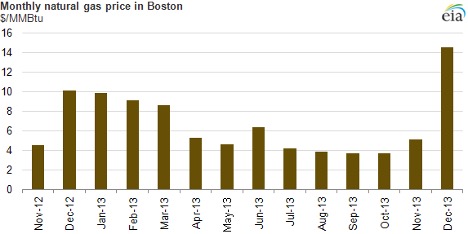
Boston saw natural gas prices spike in December. In a recent notice, the United States Energy Information Administration (EIA) shows that bidweek natural gas prices for December 2013 were nearly triple the November prices. The December settled at $14.52 per million Btu which compares to under $4 in October and $10 last December. The December 2013 prices are the highest ever recorded at the Algonquin hub that serves Boston. Nationally, prices have not risen to this degree. Factors contributing to the price spike include: pipeline/delivery constraints, cold weather in November, forecast below normal temperatures in December and maintenance downtime for secondary delivery systems. The full EIA report is available here.
Why Natural Gas Prices Spike
Residential and commercial natural gas prices will inevitably rise in response to the increased cost for the Utilities to buy gas on the open market. Since about 40% of building energy expense is space heating, natural gas customers should plan for increased natural gas prices this winter. It looks like New England will not be able to sustain the low natural gas prices seen in recent years because of the limited pipeline capacity. The reasons for this are in the second EIA chart and our interpretation, below.
Delivery Infrastructure Problem
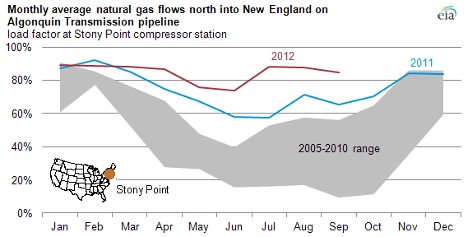
We saw natural gas prices spike because New England has infrastructure problems that limit delivery. There is simply not enough pipeline available to meet the expansion in natural gas demand that has occurred in recent years. Most of the natural gas entering New England is delivered via the Algonquin Gas Transmission pipeline system. This system has historically operated well below capacity except during peak demand. Because of increased natural gas use, the pipeline system has operated near capacity year round since 2011 and can no longer keep up with peak demand. Now, demand peaks on top of the new normal monthly requirements can’t be met — especially if secondary delivery options are constrained. Constrained capacity results in increased natural gas prices. You can read more about the pipeline here. Here is a graph that shows how much demand for the pipeline has increased in recent years: